Where app installswent in spring 2026
· 7,271 apps tracked, January to May ·



























Intro
On 16 January a company that already owned the world's largest video feed launched a short-drama app in three countries. By May it was taking twenty million installs a month, and the two apps that invented the format had lost half of theirs. Nothing in the market's headline number shows this. Worldwide downloads were flat this spring. Under the flat line, 7,271 apps in our panel moved, and in four categories they moved hard.
Monthly installs by category, January 2026 = 100.
7,271 apps with a download estimate for every month from January to May 2026 · January to May 2026, monthly download estimates
Every year starts the same way. January is the biggest month for app installs, new phones and new resolutions, and February drops 14 points below it. The whole-panel line on the chart is that shape: down in February, back to about 94 by May. Sensor Tower counted 37.5 billion downloads worldwide in the first quarter, less than one percent fewer than a year earlier, and called the second quarter flat. That is the headline, and it is boring on purpose.
The other four lines are not. Games never came back from February. Entertainment fell and stayed down while its category doubled. Productivity rose because four apps did. Navigation climbed to 117. Each line has names attached, and the names are the story.
Short drama: the auction ate its own leaders
Sensor Tower counted 850 million short-drama downloads in the first quarter, up 140% on the year. The two apps that built the format lost half their installs.

DramaBox
Entertainment12Minstalls in May
- 24Min January
- -50%January to May

ReelShort
Entertainment16Minstalls in May
- 24Min January
- -33%January to May

Kuku TV
Entertainment5.1Minstalls in May
- 10.7Min January
- -52%January to May

PineDrama
Entertainment19.7Minstalls in May
- 400kin January
- +4825%January to May

StardustTV
Entertainment5.4Minstalls in May
- 1.3Min January
- +315%January to May
Entertainment, January to May, in our estimates.
PineDrama did not exist in December. It is ByteDance's app, launched on 16 January in the United States, Brazil and Indonesia, and it broke the category's one rule: it is free. No coins, no paywall, no subscription, 17.6 million downloads in its first thirty days, paid for by interstitial ads from the company that sells them. In Insightrackr's monthly chart it went from twelfth in March to fourth in April to third in May; DataEye counted 21 million May downloads. In our panel it goes from 400k to 19.7M a month.
Meanwhile DramaBox went from 24M to 12M, ReelShort from 24M to 16M, Kuku TV from 10.7M to 5.1M. Not because people stopped watching: Sensor Tower's short-drama report has daily time in these apps at 25 minutes and revenue near $750 million for the quarter. They lost installs because installs in this category are bought, every month, in an ad auction, and the auction changed. DataEye counted 1,170 apps buying short-drama ads in May, 146 of them new that month, and now the company that runs the biggest ad network was bidding too. With fewer than nine installers in a hundred still there on day seven, every month's audience has to be re-bought. adjoe's line for it: content is sticky, but the app is not.
Gratis tonton drama baru — cuma di PineDrama!

Gratis PineDrama hot trend dramas!
Gratis tonton drama baru — cuma di PineDrama!
Gratis PineDrama hot trend dramas!
What's worse than having your nudes leaked by an ex? Falling for the dark, dangerous man who rescued you—who also happens to be your best fr

Submitting to My Bestie's Dad
What the auction looks like: PineDrama's and DramaBox's longest-running live creatives on Meta.
The assistants took the category from each other
Productivity: 437 apps, +5.2% against the panel's -6.1%. Four apps explain the rise. The smaller chatbots paid for it.

Claude by Anthropic
Productivity25Minstalls in May
- 3Min January
- +733%January to May

Meta AI
Productivity21Minstalls in May
- 9Min January
- +133%January to May

ChatGPT
Productivity94Minstalls in May
- 88Min January
- +7%January to May

Google NotebookLM
Productivity7Minstalls in May
- 2Min January
- +250%January to May

AI Chatbot
Productivity3.6Minstalls in May
- 6.6Min January
- -45%January to May
Productivity, January to May, in our estimates.
On 2 March, Claude was downloaded 149,000 times in the US. ChatGPT, the same day, 124,000.
Claude's spring has four dates. On 8 February Anthropic ran two Super Bowl spots mocking chatbots with ads in them, the day before ChatGPT switched ads on for free users; daily downloads went from 62,000 to a peak of 225,000. On 28 February Anthropic refused a Pentagon contract that OpenAI had signed four days earlier, and by Sunday Claude was number one on the US App Store with ChatGPT uninstalls up 295% in a day. In April it took 20 million downloads and entered the worldwide top ten for the first time. In May it dropped back out. In our estimates it goes from 3M a month in January to 25M in May.
Meta AI had one date. On 8 April Meta unveiled Muse Spark and the app went from 57th to 5th on the App Store overnight; 25 million of its 60 million lifetime installs arrived this year. ChatGPT added 6M on top of 88M and passed a billion monthly users.
Take the four out and Productivity is an ordinary category: 224 of its 437 apps lost a tenth or more of their installs. The losers are the wrappers. AI Chatbot Nova, an Istanbul app born as a ChatGPT skin, went from 6.6M to 3.6M; Chatbot AI Smart Search from 2M to 310k. The installs did not leave the assistant category. They moved up it, to the models that now have apps of their own.
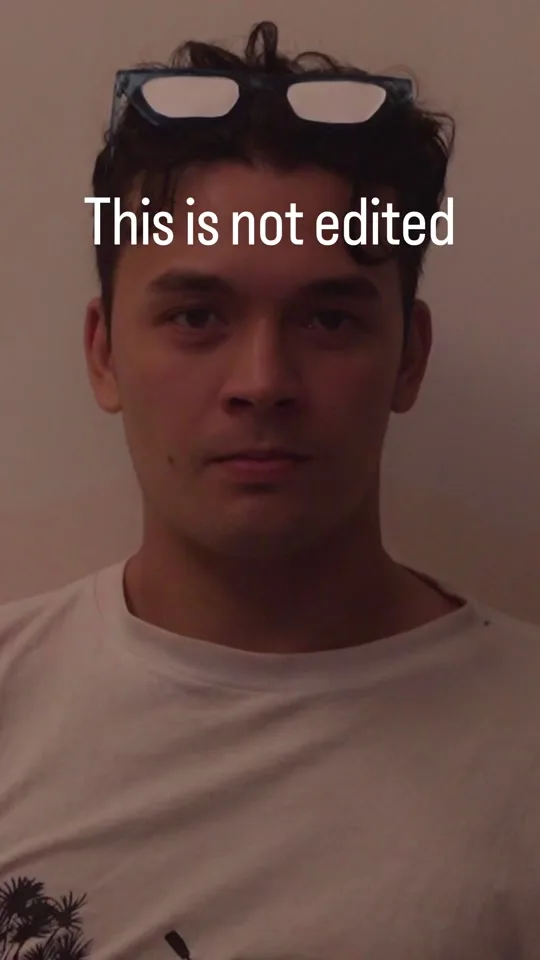
Claude Code has genuinely allowed me to build so many of my projects and I’m excited to partner with them for this video

 Claude by Anthropic
CLAUDE AI IS SUCH A POWERFUL MACHINE…Ai is literally the future #blowtbisup #ai #fyp #claudeai #youtubeautomation
Claude by Anthropic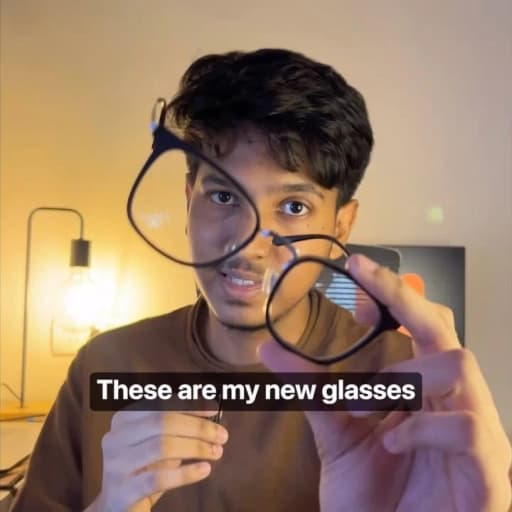
Meta AI picked glasses for me 🤯 And it actually cooked 🔥 Prompt I used is pinned 👇 Download the new @meta.ai app and tr

 Meta AI
The most-viewed creator videos we hold for Claude and Meta AI, none of them posted by the apps.
Games: one bought its installs, one lost them
1,027 games in the panel, -16% from January to May. Sensor Tower has game downloads down 12% on the year, the worst first quarter since 2019.

Block Out!
Games3Minstalls in May
- 200kin January
- +1400%January to May

Clash Royale
Games1.8Minstalls in May
- 5Min January
- -64%January to May

Football League
Games7.4Minstalls in May
- 13.4Min January
- -45%January to May

Township
Games6Minstalls in May
- 10Min January
- -40%January to May

Brawl Stars
Games7Minstalls in May
- 5Min January
- +40%January to May
Games, January to May, in our estimates.
At the end of last year, we killed Clash Royale.
Two games in one category, moving in opposite directions for opposite reasons. Block Out is a colour-sort puzzle from Grand Games, a 75-person studio in Istanbul, released last October. In our estimates it went from 200k installs in January to 3M in May, and on 11 May the studio raised $70 million with a stated purpose of accelerating marketing, the same month its two games sat first and second on the US iOS download chart. Puzzle is the one genre Sensor Tower says is still growing installs. Block Out bought its place in it.
Clash Royale had the year of its life in 2025, $647 million in revenue, and then a monetisation update in November that its own players read as a betrayal. Revenue halved between October and January. In February its biggest streamer called a Supercell post that left creators out the biggest spit in the face he had ever seen, and the CEO amended it. Installs are the lagging indicator: 5M in January, 1.8M in May. In August, at Gamescom, the design lead said the quiet part out loud.
The rest of the category's fall is the calendar. Football League 2026 went from 13.4M to 7.4M as the season ended and picked up again in June when the World Cup started. Township, PUBG Mobile and Free Fire all shed a third. Naavik's reading of the market-wide decline is that Android and emerging markets carried nearly all of it: cheap installs drying up as ad prices rise.
May belongs to the apps people use when they leave the house
Navigation +17%, Food & Drink +17%, Business +9%, Travel +5%: the categories that grew against the tide.

Waze Navigation & Live Traffic
Navigation6Minstalls in May
- 2Min January
- +200%January to May

Uber
Navigation15Minstalls in May
- 12Min January
- +25%January to May

NBA
Sports2.2Minstalls in May
- 400kin January
- +450%January to May

FIFA World Cup 2026
Sports1.3Minstalls in May
- 70kin January
- +1757%January to May

toing
Food & Drink6.4Minstalls in May
- 20kin January
- +31900%January to May
Navigation, Sports and Food & Drink gainers, January to May.
Some install curves have a date on them. FIFA delivered every World Cup ticket as a mobile ticket inside its app from 18 May, three weeks before the tournament opened; the app went from 70k installs in January to 1.3M in May. The NBA playoffs ran from 18 April to the most-watched Finals in 28 years, in the first season the league put League Pass inside its own app; the NBA app went from 400k to 2.2M. Uber added 3M installs a month on top of 12M in a quarter it called an exceptional start, with 199 million monthly customers. Waze tripled, from 2M to 6M, and we could not find out why; the honest reading is that we do not know.
The biggest relative mover in the whole panel is not a startup. toing is Swiggy's second brand, a delivery app for people who order once a month: no platform fee, no packaging fee, dishes under 99 rupees. It launched in Pune last autumn, was in 22 cities by March, and went from 20k installs to 6.4M. Without it, Food & Drink is flat. A category sum can be one app wearing the category's name, which is why the chart below counts how many apps moved and not only how much.
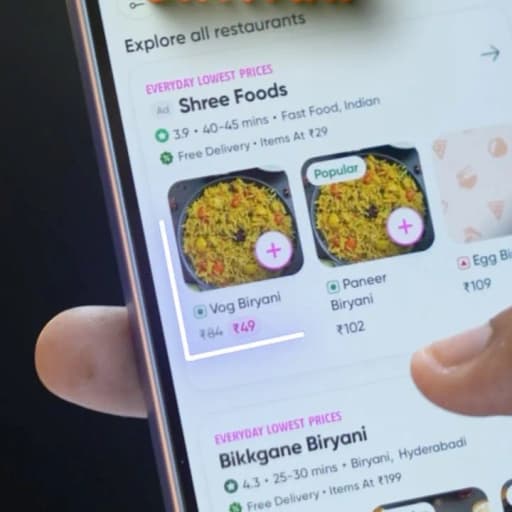
You won’t believe the prices! Follow @digidoty for more money‑saving tips! [food hacks, cheap food app, Toing, budget
 toing
toing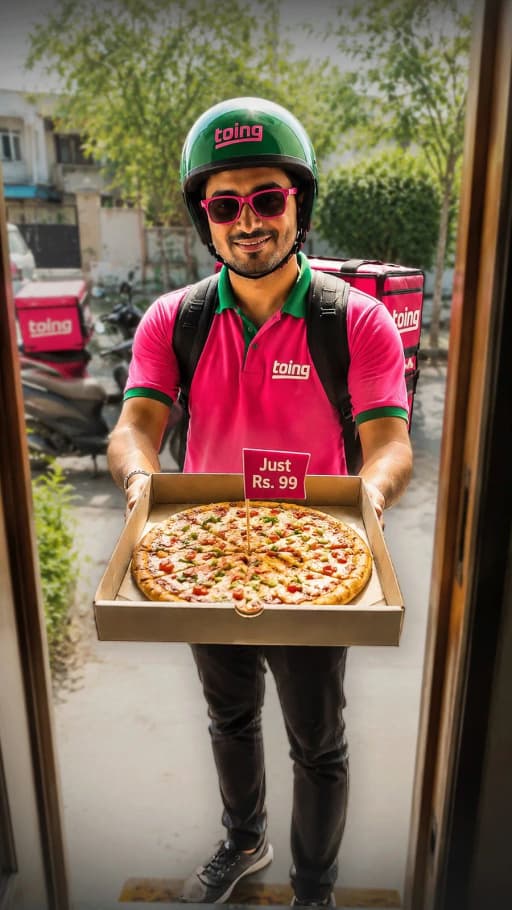
How toing is completely changing how people order food in India! [ Food, Marketing, Branding, Business ] #ad
toing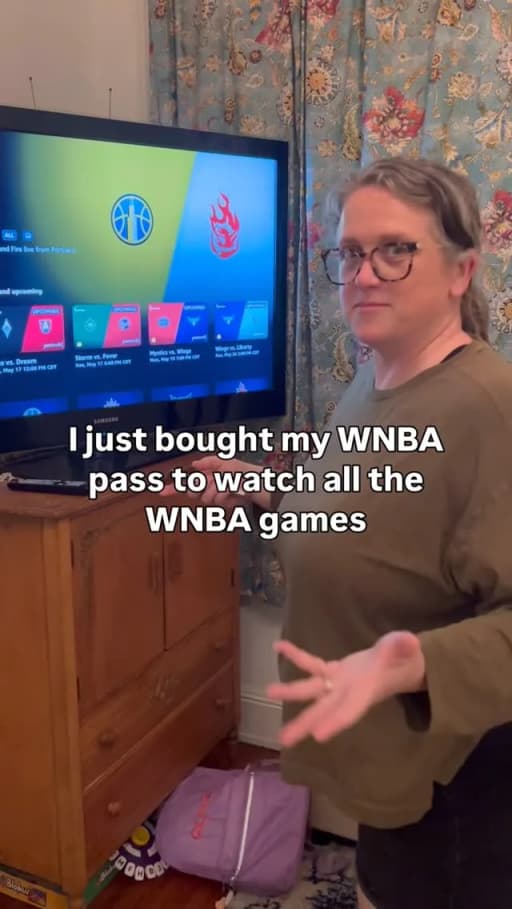
The @wnba league pass should allow me to watch every WNBA game. Why would you have it on the NBA app? Make it make sense
 NBA
NBAThe most-viewed creator videos we hold for toing and the NBA app.
Every category, against the tide
Change in summed installs from January to May, relative to the panel's own -6.1%. Categories with 40 or more panel apps.
Percentage points above or below the panel's January-to-May change.
7,271 apps with a download estimate for every month from January to May 2026 · January to May 2026, monthly download estimates
How to read it, in three questions
Flat overall means some categories are shrinking hard and some are being handed from old leaders to new ones.
Is your category's curve the calendar or a trend? Put it against the panel line. Within a few points of it, and you are looking at January; ten points below, like Games, and something structural is happening.
Who is the new bidder? In short drama the leaders lost half their installs while the category grew 140%, because a new entrant with a free product and an ad network of its own joined the auction. If your installs are bought, the leader's curve tells you nothing about the category's; it tells you who is outbidding them.
Is there a date on it? World Cup tickets, a playoff run, a Super Bowl spot, a Pentagon weekend, a $70 million round for marketing. Most of the big moves this spring have one. A curve with a date is a curve you can plan around; a curve without one, like Waze's, is a question.